
Economic Snapshot: Markets improve as inflation stabilises
In early July, the RBA surprised markets by not raising cash rates. Despite expectations for an increase in August, the lower June inflation (CPI) saw rates again maintained at 4.1%.
Global equities rose 2.1% in the month, with a 20% year-to-date gain in AUD terms. Value, small caps, and cyclical-stocks led the rally.
Australian equities outperformed hedged global equities slightly, rising 2.9%, with eight of eleven sectors growing. Banks surged 4.9%, energy, IT, and REITs (property) rose. Healthcare fell 1.5% due to CSL's guidance for weaker profitability.
Global and Australian bond yields rose initially but retreated later due to weaker US labour data and lower June inflation data.
Asset Class Returns - July 2023
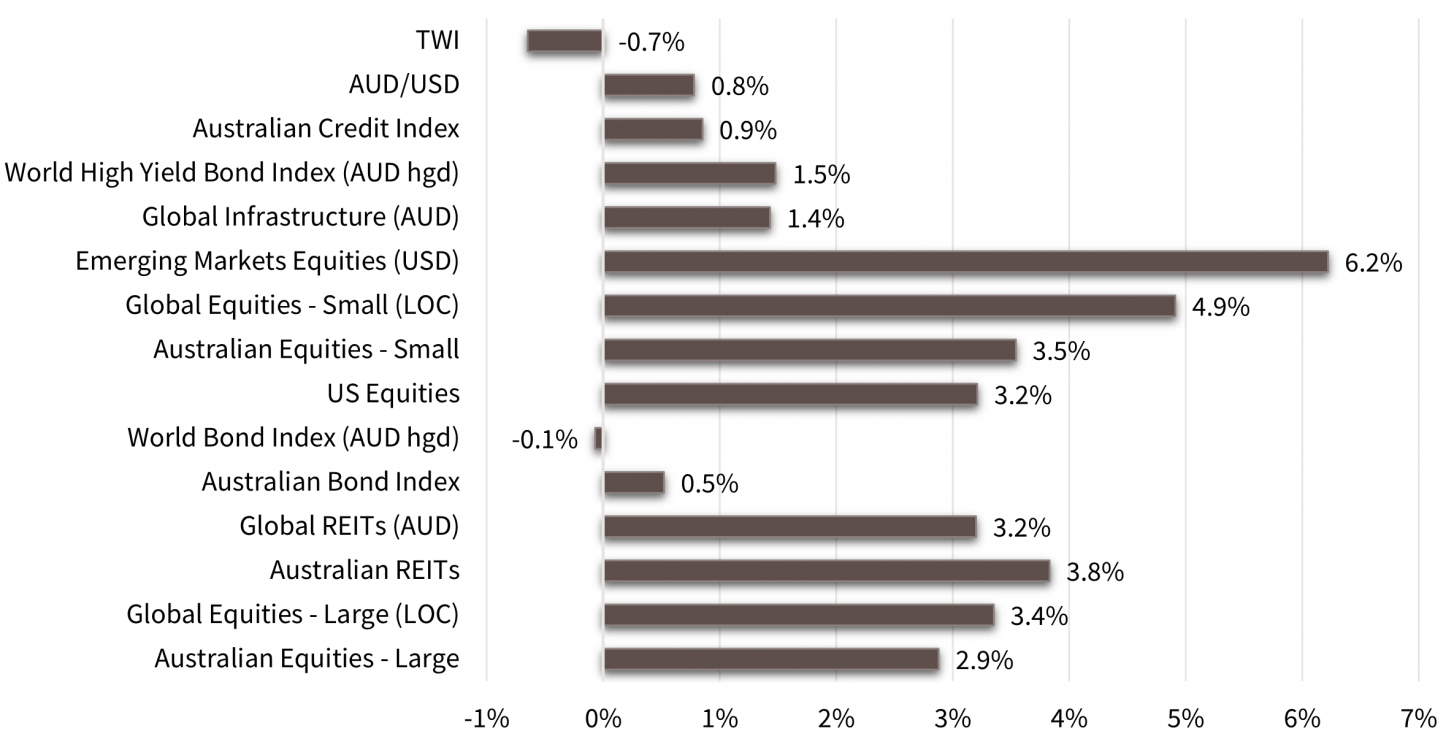
Source: Zenith Investment Partners Pty Ltd, Monthly Market Report, Issue 113, July 2023
Global Developed Equities
In July, global developed equity markets sustained their rally, surging 3.4% to achieve a 19.2% year-to-date gain in USD terms. This trend encompassed value, small caps, cyclicals, and sectors like banks, energy, REITs, and materials. The MSCI World ex-Australia index rose 13.6% for the year, reaching a 17.6% increase in AUD terms.
The rally reflects a higher probability of a "soft landing," fuelled by declining inflation and sustained growth.
Market expectations for the peak Federal Reserve funds rate hovered around 5.4%, even as the market removed the prospect of easing due to stronger economic and company earnings growth. US bond yields echoed the changing Fed outlook, hitting 4.06% and ending at 3.97%.
Despite higher bond yields, equities absorbed the impact, buoyed by robust economic and earnings data. US GDP grew by 2.4% in the second quarter, with nominal GDP over 6% higher year-on-year, contributing to resilient company earnings. Second quarter earnings dipped 7.3% (FactSet data), less severe than past recessions' 15-20% averages. Consensus expectations anticipate improvement throughout 2023-2024.
In contrast to rising real yields, PE multiples surged. Since March, the US forward PE expanded from 18 to nearly 20, despite a 50 basis points increase in 10-year TIPs yields to 1.72%.
The rally has been led by a small number of companies, closely linked to an AI-related theme. The rally broadened in June-July to include more cyclical, risk-on assets and sectors.
The Bank of Japan tweaked its Yield Curve Control, widening the band for bond yields towards 1%, impacting Japanese equities modestly. The Japanese equity index rose 3%, up 16.4% year-to-date. Europe ex-UK and the US markets both increased by 3.4%.
Sectors like banks, energy, communications, and materials gained momentum, along with global small caps (up 4.9%). Value and cyclical stocks also benefited from an increased likelihood of a "soft landing".
Australian Equities
In the Australian equity market, performance slightly trailed global equities, rising by 2.9% in the month and a total of 7.5% year-to-date.
Eight out of eleven sectors saw gains, with banks surging by 4.9%, energy stocks rising by 8.4% due to higher oil prices, IT sector by 4.8%, and REITs by 3.8%. However, the healthcare sector suffered a 1.5% decline due to weaker earnings guidance from CSL. The small cap index performed well, increasing by 3.5%.
The Reserve Bank of Australia (RBA) surprised by not raising cash rates in early July, offering relief to the equity market. Market expectations were for a rate hike in August, but the RBA chose to again hold rates at 4.1% in early August. June quarter CPI came in below expectations at 6.0% for headline inflation and 5.9% for core inflation, influencing the RBA's decision.
The Australian unemployment rate stood at 3.5% in June, with 32,000 jobs added, indicating a tight labour market. Despite this, the RBA maintains a mild tightening bias. Housing prices rebounded, increasing by over 4% after a 9% drop until February.
However, dwelling approvals and housing finance remained weak. Business conditions were easing, and real retail spending fell 0.5% in the June quarter, marking the third consecutive decline.
Earnings-wise, consensus predicts approximately 2% growth for the next 12 months after a small decline over the past year.
The bank sector's forward EPS growth is at -4%, while materials EPS growth expectations are close to 10%.
The RBA's decisions, labour market conditions, housing sector trends, global economic growth (and particularly Chinese growth), and earnings projections are key factors shaping the Australian equity landscape.
Emerging Markets
Emerging markets surged 6.2% in USD terms in July, reaching an 11.4% year-to-date gain.
Chinese equities notably thrived, with the MSCI China index rising 10.8%, driven by promised policy stimulus and acknowledgment of economic weaknesses during the July Politburo meeting.
China pledged to enhance domestic demand, boost consumption, and address property market dynamics and local government debt.
Though lacking in specifics, the meeting aimed to mitigate property and broader economic risks.
Chinese economic data revealed weak purchasing manufacturer index (PMI) readings, contrasting with strong figures from India and Korea, albeit still contractionary.
The MSCI Asia index climbed 6.2%, Europe 10%, and Latin America 5.2%. Noteworthy 2023 performers include Poland and Mexico.
Property & Infrastructure
In July, Australian Real Estate Investment Trusts (A-REITs) increased by 3.8%, resulting in a year-to-date return of 7.9%, slightly surpassing the broader equity market.
Global REITs also saw a rebound, rising 3.2% in the month, with a 4.2% gain for the year thus far. The focus remains on property valuations, particularly office spaces due to lower occupancy and higher real yields. Despite the 2023 bounce, A-REITs remain around 15% below their 2021 peak, having likely incorporated a decline in asset values.
Office valuations are being adjusted downward, introducing uncertainty. Rising real yields have negatively impacted property and infrastructure values.
While global infrastructure gained 1.4% in the month, it considerably lagged equities, showing only a 0.1% year-to-date increase.
Fixed Interest – Global & Australia
Global bond yields climbed in early July, with the US 10-year treasury surpassing 4%. This rise was driven by strong private sector job data and hawkish comments from Fed members. However, weaker-than-expected payrolls and a lower June CPI eased Fed funds projections.
US CPI dropped to 3% in June, down from 4%, and core CPI decreased to 4.8%. Market expectations suggest the Fed funds rate has likely peaked at 5.25-5.5%, anticipating five cuts to 4% by late 2024.
The European Central Bank raised rates by 25 basis points to 3.75%, signalling nearing peak borrowing costs.
The Bank of Japan adjusted its yield curve control, allowing bond yields to rise as high as 1%, reflecting inflation above 3%, even surpassing US inflation.
Global bonds returned -0.1% for the month and 2% year-to-date. Recession fears subsiding saw credit spreads narrow. Fitch's downgrade of US debt to AA+ further elevated yields in August.
Australian bond yields initially rose to 4.3% in July, following US yields higher. However, weak US labour data and dis-inflation signs led to a 40-basis point rally over 10 days, with yields at 3.86%.
Despite improved Australian inflation figures, yields climbed back to 4.06%. The lower-than-expected 6% CPI for June prompted a decline in the 2-year yield to 3.98% from 4.18%.
Surprisingly, the RBA didn't raise cash rates in July, seen as a pause, with expectations for a hike in August. June CPI came below consensus at 6.0% for headline and 5.9% for core.
The RBA, led by Governor Philip Lowe for the last time, held rates at 4.1% in August. Housing prices rebounded by over 4%, though approvals and finance were weak.
NAB business conditions eased, while retail spending fell 0.5% in Q2, marking three declines not seen since 2008.
Commodities
Commodity prices rose in July due to hopes of a soft landing and Chinese policy stimulus.
Brent crude surged 14.2% to $85.56/barrel with extended OPEC production cuts. Copper gained 5.2%, while iron ore dipped 2.2% to $111/tonne.
Though China's industrial recovery lagged post-reopening, recent stimulus brought optimism. Weakening USD drove gold up 3.3% to $1970.65/ounce. In contrast, the RBA commodity price index fell 3.1% in July and suffered an 18% year-to-date loss.
Currencies
In July, the USD declined about 1% on a trade-weighted basis, influenced by lower inflation data and reduced rate hike expectations.
The euro gained almost 1% against the USD, reaching 1.1, while the yen ended at 142.3 from 144.3. The pound also rose. The AUD slightly strengthened to 67.2 cents against the USD, but its trade-weighted value dropped 1% for the month.
Most emerging market currencies were stronger. Shifting expectations regarding US Fed funds and RBA cash rates primarily affected AUDUSD, with less attention on commodity markets.
Market bets on further US Fed tightening decreased, and Australian cash rates are expected to remain below US rates until mid-2025.
Disclaimer: This document has been prepared for the FMD Financial Economic Snapshot by FMD Group and is intended to be a general overview of the subject matter. The document is not intended to be comprehensive and should not be relied upon as such. We have not taken into account the individual objectives or circumstances of any person. Legal, financial and other professional advice should be sought prior to applying the the information contained in this document. Advice is required before any content can be applied at a personal level. No responsibility is accepted by FMD Group or its officers. Past performance is not an indication of future performance.
General advice disclaimer: This article has been prepared by FMD Financial and is intended to be a general overview of the subject matter. The information in this article is not intended to be comprehensive and should not be relied upon as such. In preparing this article we have not taken into account the individual objectives or circumstances of any person. Legal, financial and other professional advice should be sought prior to applying the information contained on this article to particular circumstances. FMD Financial, its officers and employees will not be liable for any loss or damage sustained by any person acting in reliance on the information contained on this article. FMD Group Pty Ltd ABN 99 103 115 591 trading as FMD Financial is a Corporate Authorised Representative of FMD Advisory Services Pty Ltd AFSL 232977. The FMD advisers are Authorised Representatives of FMD Advisory Services Pty Ltd AFSL 232977. Rev Invest Pty Ltd is a Corporate Authorised Representative of FMD Advisory Services Pty Ltd AFSL 232977.