
Economic Snapshot: Positive returns for markets
Summary
April saw positive returns across the board for financial markets. Equities and commodities performed especially well. Bond markets steadied in April, after fears in previous months about the risk of higher inflation, stemming from the robust pace of the current economic recovery. Data showing softer than expected March quarter inflation in Australia helped the local bond market.
The better performance of the bond markets provided a good backdrop for equity markets. ‘Bond sensitive’ equities such as real estate investment trusts (REITs) did well, while the broader US equity market was supported by a solid company earnings reporting season. The US equity market reached new highs, but the Japanese market declined as a renewed COVID wave saw the reimposition of lockdowns.
The emerging markets indices rallied, despite weakness of the Indian equity market which was also caused by COVID developments in that country. A weaker US$ helped Emerging Market equities rally in April. It also helped the A$ move back towards US$0.78. The big rally in the iron ore price also helped support the A$. The price of gold rose as US real bond yields and the US$ declined.
A key question for the markets now is how Mr Biden’s next big fiscal package affects the economy and how it is to be funded. The more it is funded by tax increases, the less pressure on bond markets, but the greater the potential pressure on company earnings and consumer and business spending. The more it is funded by issuing bonds, the greater the pressure for bond yields to rise which could hurt equity valuations and the price of gold.
Chart 1: April was a good month across the board for markets
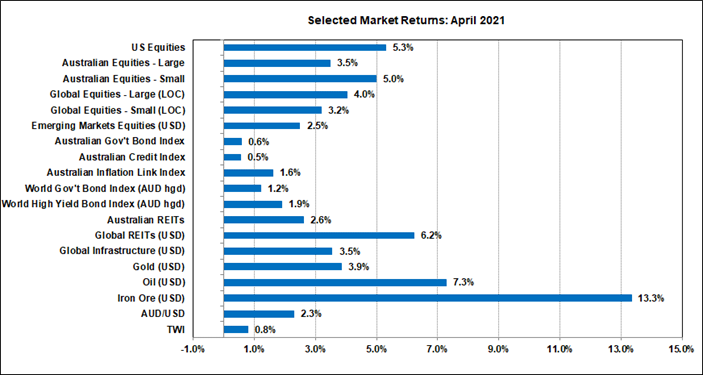
Source: Thomson Reuters, Bloomberg 1 May 2021
Financial Markets
April saw positive returns across the board for financial markets. Equities and commodities performed especially well. Bond markets steadied in April, after their fears in previous months about the risk of inflation stemming from the robust pace of economic recovery. In both Australia and the US, the 10-year government bond yield started the month around 1.75% and finished around 1.6%.
Inflation data
Factors contributing to this performance included reassuring statements from central banks that any near-term inflation pressures are likely to be temporary, as well as moderate readings for the latest CPI inflation data. For example, here in Australia, the March quarter CPI figures came in softer than expected. Headline inflation rose 0.6% in the quarter and 1.1% over the year to March.
The equivalent figures for underlying inflation were 0.3% and 1.1%. Some changes to government grants contributed to the softer March quarter result but even so, the inflation figures reflect the degree of spare capacity in the economy. Even though the economy is recovering faster than the Reserve Bank expected, they still do not see sustained inflation for “some years”. In the US, inflation picked up a bit in March but was broadly in line with the markets’ expectations.
Bond Markets
The better performance of the bond markets helped provide a good backdrop for equity markets in April. For example, global REITs, which are sensitive to movements in bond yields, had a very good month with a 6.2% rally. Locally, AREITs did not perform at that pace but still managed to rise by 2.6%.
USA
In the broader US equity market, the company reporting season went well with many companies, including some of the big tech stock names like Apple, reporting better than expected earnings. The S&P500 rose just over 5% in April to reach new highs, over the 4,000 mark. The local and European equity markets could not match that but still posted good positive returns.
However, the Japanese equity market underperformed with a 2.8% fall, reflecting the impact of the renewed COVID wave which has lead to lockdowns in parts of Japan. Emerging equity markets had a better month after underperforming through February and March. The 2.5% gain in the Emerging Markets index in April reflected the weaker US dollar seen through the month. The US dollar softened as markets wound back their expectations of the Fed lifting interest rates anytime soon.
The strength of the US earnings reporting season obviously reflects the strong economic recovery happening there. Analysts are now starting to wonder if we have seen the best of US growth and are questioning if it slows from here. Central to this question is what Mr Biden’s next fiscal package will look like.
So far, he has announced spending on infrastructure and other programs of around US$2.25 trillion, with increases in taxes on companies and wealthy individuals to help pay for it. The equity market initially baulked at the idea of higher taxes eating into company profits, but soon recovered. The stimulus provided by the package would be significant and spread over several years.
Australia
Within the local equity market, resources and banks performed well in April, with the former assisted by the 13.3% increase in the iron ore price driven by demand from China. This also helped push the A$/US$ up from US$0.760 at the start of the month to US$0.778 by 30 April. The softer US$ also helped, but the A$/US$ is still trading at levels well below what the iron ore price would suggest. Bond differentials with the US and the path of the US$ currently remain the key drivers of the A$/US$.
Commodity Markets
In commodity markets, the price of oil rose 7.3% despite the big COVID wave in India raising concerns about the demand for oil. The price of gold had a better month after some sustained weakness. The recent rally was assisted by a decline in US real bond yields and in the US$. A key question for gold is whether further US fiscal stimulus starts to push bond yields up again, which would tend to undermine the gold price.
Chart 2: Major Market Indicators – April 2021
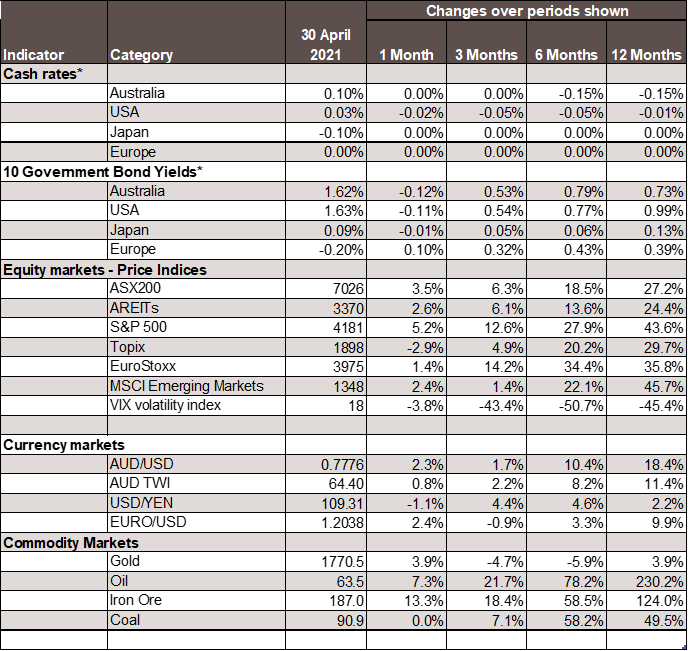
*For cash rates and bonds, the changes are percentage differences; for the rest of the table percentage changes are used.
Disclaimer: This document has been prepared for the FMD Financial Economic Snapshot by Caravel Consulting Services Pty Ltd [AFSL 320842] and is intended to be a general overview of the subject matter. The document is not intended to be comprehensive and should not be relied upon as such. We have not taken into account the individual objectives or circumstances of any person. Legal, financial and other professional advice should be sought prior to applying the information contained in this document. Advice is required before any content can be applied at personal level. No responsibility is accepted by Caravel Consulting or its officers.
General advice disclaimer: This article has been prepared by FMD Financial and is intended to be a general overview of the subject matter. The information in this article is not intended to be comprehensive and should not be relied upon as such. In preparing this article we have not taken into account the individual objectives or circumstances of any person. Legal, financial and other professional advice should be sought prior to applying the information contained on this article to particular circumstances. FMD Financial, its officers and employees will not be liable for any loss or damage sustained by any person acting in reliance on the information contained on this article. FMD Group Pty Ltd ABN 99 103 115 591 trading as FMD Financial is a Corporate Authorised Representative of FMD Advisory Services Pty Ltd AFSL 232977. The FMD advisers are Authorised Representatives of FMD Advisory Services Pty Ltd AFSL 232977. Rev Invest Pty Ltd is a Corporate Authorised Representative of FMD Advisory Services Pty Ltd AFSL 232977.